One of my favorite NumPy functions is roll(). Here's an example of using this function to get neighborhood indices to create adjacency matrices for images.
An adjacency matrix is a way of representing a graph and shows which nodes of the graph are adjacent to which other nodes. For n nodes is is an n*n matrix A where a_ij is the number of edges from vertex i to vertex j. The number of edges can also be replaced with edge weights depending on the application.
For images, a pixel neighborhood defines a graph which is sparse since each pixel is only connected to its neighbors (usually 4 or 8). A sparse representation, for example using dictionaries, is preferable if only the edges are needed. For clustering using spectral graph theory, a full matrix is needed. The following function creates an adjacency matrix in sparse or full matrix form given an image:
Use it like this:
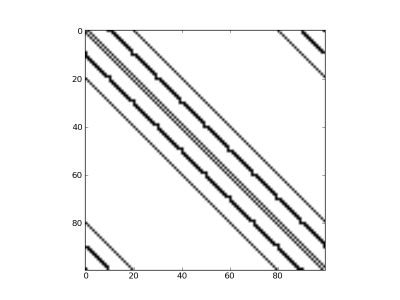
Which should give you an image like the one below.
![]()
An adjacency matrix is a way of representing a graph and shows which nodes of the graph are adjacent to which other nodes. For n nodes is is an n*n matrix A where a_ij is the number of edges from vertex i to vertex j. The number of edges can also be replaced with edge weights depending on the application.
For images, a pixel neighborhood defines a graph which is sparse since each pixel is only connected to its neighbors (usually 4 or 8). A sparse representation, for example using dictionaries, is preferable if only the edges are needed. For clustering using spectral graph theory, a full matrix is needed. The following function creates an adjacency matrix in sparse or full matrix form given an image:
from numpy import *

def adjacency_matrix(im,connectivity=4,sparse=False):
 """ Create a pixel connectivity matrix with
  4 or 8 neighborhood. If sparse then a dict is
  returned, otherwise a full array. """

 m,n = im.shape[:2]

 # center pixel index
 c = arange(m*n)
 ndx = c.reshape(m,n)

 if sparse:
  A = {}
 else:
  A = zeros((m*n,m*n))

 if connectivity==4: # 4 neighborhood
  hor = roll(ndx,1,axis=1).flatten() # horizontal
  ver = roll(ndx,1,axis=0).flatten() # vertical
  for i in range(m*n):
   A[c[i],hor[i]] = A[hor[i],c[i]] = 1
   A[c[i],ver[i]] = A[ver[i],c[i]] = 1

 elif connectivity==8: # 8 neighborhood
  hor = roll(ndx,1,axis=1).flatten() # horizontal
  ver = roll(ndx,1,axis=0).flatten() # vertical
  diag1 = roll(roll(ndx,1,axis=0),1,axis=1).flatten() # diagonal
  diag2 = roll(roll(ndx,1,axis=0),1,axis=0).flatten() # diagonal
  for i in range(m*n):
   A[c[i],hor[i]] = A[hor[i],c[i]] = 1
   A[c[i],ver[i]] = A[ver[i],c[i]] = 1
   A[c[i],diag1[i]] = A[diag1[i],c[i]] = 1
   A[c[i],diag2[i]] = A[diag2[i],c[i]] = 1

 return A
Use it like this:
from pylab import *

im = random.random((10,10))
A = adjacency_matrix(im,8,False)

figure()
imshow(1-A)
gray()
show()
Which should give you an image like the one below.
