Matplotlib has an interesting toolkit called Basemap for plotting geo data and maps. Basemap handles all the possible map projections and uses Matplotlib to do the plotting. Basemap also includes data like countries, coastlines and background satellite images from NASA Blue Marble.
Plotting geo data using Basemap is actually very simple. Here is an example with geo data from Twitter using the script in my previous post.
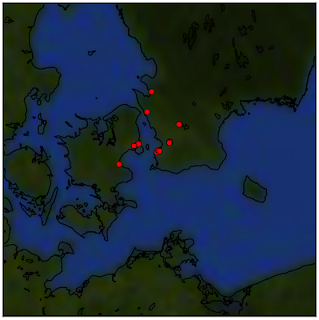
This example takes tweets in a 100km radius around Malmö, Sweden and plots the location with red dots on top of a NASA Blue Marble image with coastlines drawn. The result looks like this:
![]()
Pretty simple. If you had some dense data like weather or topographic data, that could be placed on the map (e.g. using Matplotlib's contour()) and opens up interesting possibilities for data visualization.
Plotting geo data using Basemap is actually very simple. Here is an example with geo data from Twitter using the script in my previous post.
from mpl_toolkits.basemap import Basemap
from pylab import *
import twitter_geo

# setup Lambert Conformal basemap.
m = Basemap(width=400000,height=400000,projection='lcc',resolution='f',lat_0=55.5,lon_0=13)
m.bluemarble() #background
m.drawcoastlines() #coastlines

# get some geo data from Twitter
geo = '55.583333,13.033333,100km' #Malmo, Sweden
tweets = twitter_geo.parse(twitter_geo.search(geo=geo))

for t in tweets:
    coords = t[2]['coordinates']
    x,y = m(coords[1],coords[0]) #project to map coords
    plot(x,y,'ro')

show() #you might not need this
This example takes tweets in a 100km radius around Malmö, Sweden and plots the location with red dots on top of a NASA Blue Marble image with coastlines drawn. The result looks like this:

Pretty simple. If you had some dense data like weather or topographic data, that could be placed on the map (e.g. using Matplotlib's contour()) and opens up interesting possibilities for data visualization.